How Easy is Security Onion to Get Setup
This article is the first of a series of articles, below we will explain general information about Security Onion as well as perform a practical installation.
Presentation of the open source platform for network and host monitoring
- Official website https://securityonionsolutions.com/
- Official documentation https://docs.securityonion.net/en/2.3/
- Official repository https://github.com/Security-Onion-Solutions/securityonion
What is Security Onion?
Security Onion by Security Onion Solutions, LLC is a free and open source platform for network, host and enterprise security monitoring and log management (collection and subsequent analysis). With the available package collections, Security Onion offers an optimal, highly scalable solution for high-demand incident response and forensics use cases – but also for simple experimentation in the home lab.
Security Onion is suitable for companies of different sizes as well as for home networkers, security enthusiasts and home labbers! For the latter, it's a wonderful way to get deeper into the world of intrusion detection & network monitoring!
Security Onion can be used both proactively and reactively, for example by proactively discovering vulnerabilities (not by included vulnerability scanners like OpenVas, which is included in OSSIM) or expiring SSL certificates, as well as responding to security incidents and subsequent forensic investigation.
The basic functions can be divided into these core functions:
- Full packet capture
- Network and endpoint detection (rule-based)
- Analysis and correlation of the acquired data sets
These core functions are implemented using the following program packages, among others:
- Suricata (IDS/IPS rule-based detection fingerprints and identifiers)
- Zeek (powerful network analysis framework, formerly Bro)
- Wazuh (HIDS/EDR -log analysis, file integrity checking, policy monitoring, rootkit detection, real-time alerting)
- ElasticStack (visualization and search operations – Elastic Search Query,)
- TheHive (reporting and escalation – incident-response platform, including MISP)
- Strelka (real-time file analysis for IR)
- Support for Sigma rules (log conversion for other platforms, Splunk, Logrythm,ESQ)
- Grafana/influx (graphical interface for independent system monitoring/alerting)
- Fleet (Osquery management)
- Playbook (individual detection rule sets -detection strategy)
- OnionHunt (correlation tool)
- SO-Console (web-based access to individual components)
- Syslog and Beats (integration optional)
Data types which Security Onion or its components can process and generate
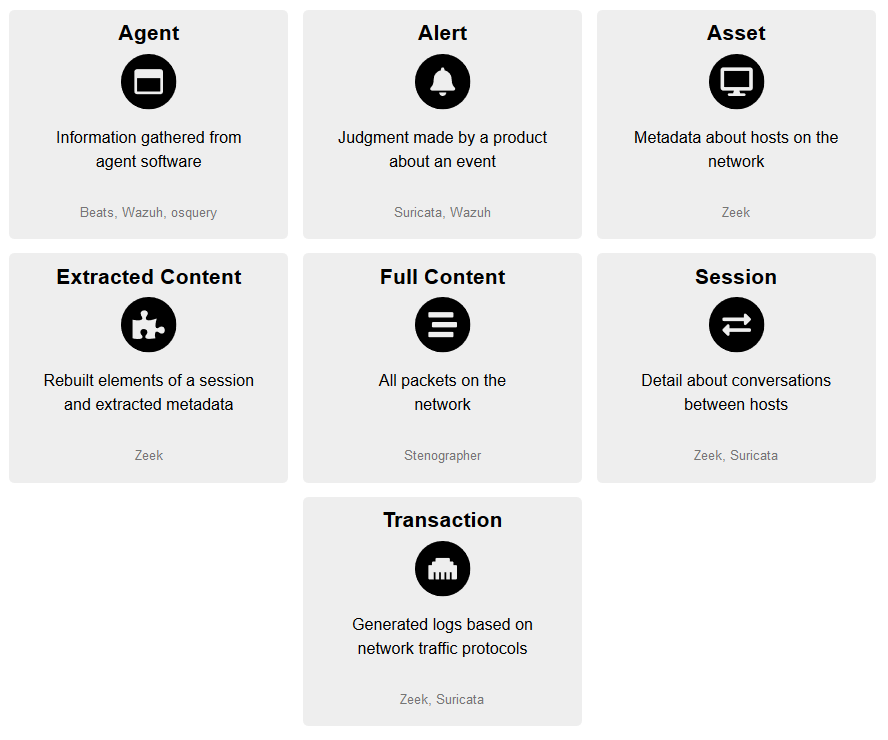
Security Onion General
Since version 2.0 Security Onion is based on CentOS 7, but can also be installed manually via CLI on Ubuntu 18.04 and CentOS 7.
The installation and management of the individual package collections is realized with the help of Docker containers. Since many different use cases are supported, scaling is also possible on a large scale. From dedicated and distributed installations with separate sensors and independent search nodes to installations in air-gapped environments, many scenarios are possible. Meanwhile, Security Onion is also available in the AWS Marketplace, implementations in Azure are also possible.
For a virtualized installation, at least one network interface must be assigned to the VM via PCI passthrough. Please note that Intel features like VT-D (AMD IOV) have to be available on the hardware side and have to be activated accordingly (check motherboard chipset & CPU specifications).
Security Onion has been using Suricata as IDS since 2.X, unfortunately deployment is only possible in IDS mode.
Scenario of a setup
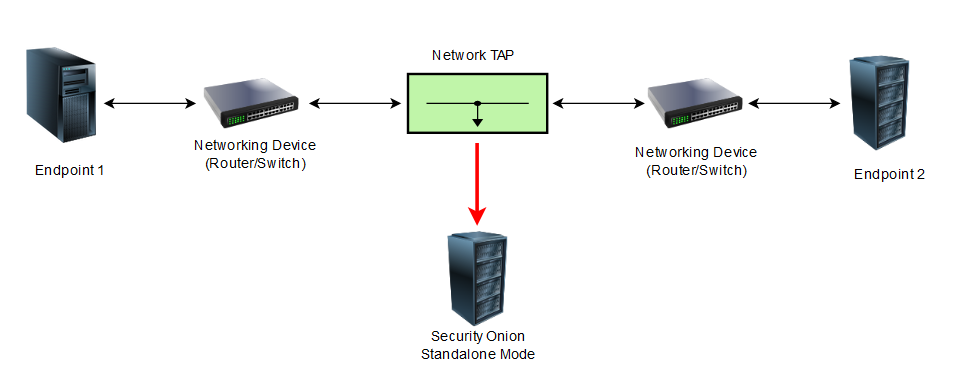
A simplified topology for standalone mode operation would look like this:
In this example the data line is duplicated 1:1 by a TAP Device, which also redirects the stream to the sensor devices (Security Onion). This enables the observation of network traffic between network segments or endpoint within an segment. Usually these techniques are set up to monitor network transitions, for example between two networking devices such as routers or switches.
Depending on the desired performance, you have to decide whether to use classic TAPs or switches with port mirroring.
The following scenario can be achieved with a 40$ managed switch (Netgear GS308e or Mikrotik Routerboard RB2011 models). The Setup is much more easier, but take note that this setup is not recommended for large scale networks due to performance issues.
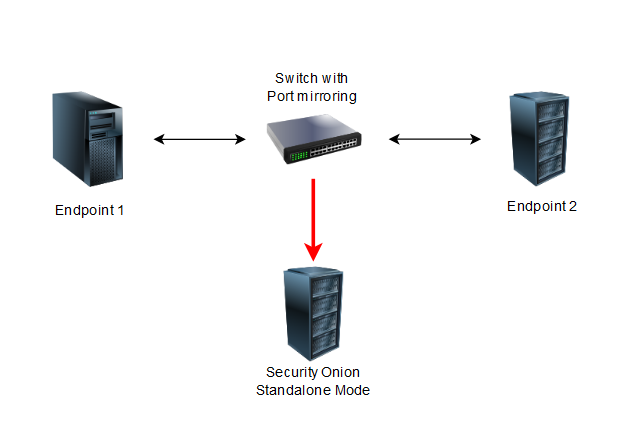
For enterprise networks it is recommended to spend more money on a physical TAP that can send and receive data flows simultaneously without losing data or not "seeing" them.
In conclusion, the following can be said:
- TAPs are cost-intensive, but enable complete packet recording and thus the deepest and most effective mirroring of data flows.
- SPAN or mirrored ports are suitable for scenarios in which possible (high) costs are a decisive factor and the full coverage of the data is not a primary goal. Logically, this option is rather unsuitable for setting up a system for network monitoring in production environments.
Detection strategy and possible use cases
At the heart of any network monitoring is the strategy applied based on knowledge of existing assets (endpoints and software in use), risk assessment and typical network activity.
Because each network is unique, there cannot be template solutions that can be adapted and applied within a short period of time. Any system design that aims to increase the security of the network and systems must be carefully planned and evaluated. The basic goal is to look through the entire infrastructure and evaluate the communication of individual systems with each other, in other words to distinguish regular everyday data streams from irregular ones. Determining whats a typical day-to-day behaviour on the network.
True to the motto, "You can't back up what you can't see."
The detection process can be represented within the Standalone Deplyoments as follows:
- Individual records are collected and processed by Security Onion's core components.
- When a record, e.g. a downloaded file, hits a rule set, an event (log) is generated.
- This event is sent by Filebeat to Logstash, which in turn forwards the log to the Redis queue.
- A second Logstash pipeline fetches the logs from Redis and sends them to Elasticsearch, where they are parsed and indexed.
This type of deployment is typically used for testing, labs, POCs, or very low throughput environments.

The following is a list of possible use cases:
- Compliance monitoring
- Data exfiltration detection
- Endpoint compromise detection
- Suspicious login and account compromise detection
- and much more
Installation von Security Onion
It should be mentioned at the outset that this is purely a demonstration. If Security Onion is to be used in production environments, there are a few more steps to consider, such as evaluating individual rule sets that are all enabled by default. See https://docs.securityonion.net/en/2.3/customizing.html & https://docs.securityonion.net/en/2.3/tuning.html
For the demonstration, the prebuilt ISO image (SO v. 2.3.51) is used instead of a "manual" installation. The installation is done inside a VM using VirtualBox (VmWare Workstation & Fusion is also possible). See https://docs.securityonion.net/en/2.3/vmware.html & https://docs.securityonion.net/en/2.3/virtualbox.html.
In addition to Security Onion, a Windows Server 2019 as ADDC, a Windows 10 Client and an Ubuntu Server as VM will be installed. The Windows systems are evaluation versions obtained at https://www.microsoft.com/de-de/evalcenter/. The Ubuntu server is a so-called boot2root VM with existing vulnerabilities – https://www.vulnhub.com/entry/basic-pentesting-1,216/. The setup and installation of the above systems is not covered here.
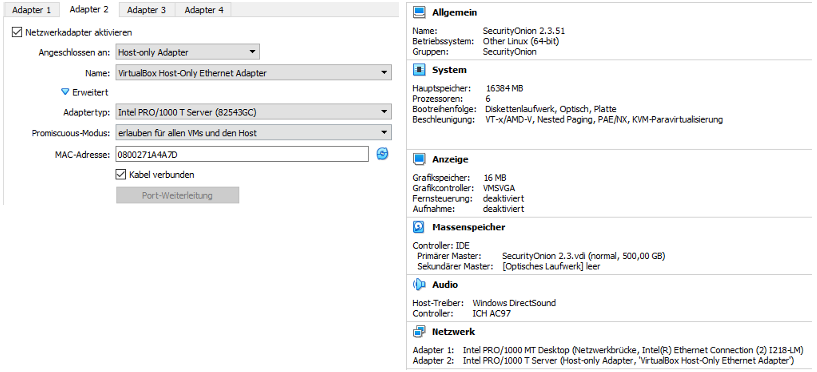
When setting up Security Onion, it is important to operate a host-only interface in promiscuous mode. In this mode, a network adapter can forward all received traffic, regardless of which adapter the traffic is addressed to. (Netzwerkbrücke = Networkbridge, or bridged Network Interface)
The following is a rough network diagram:
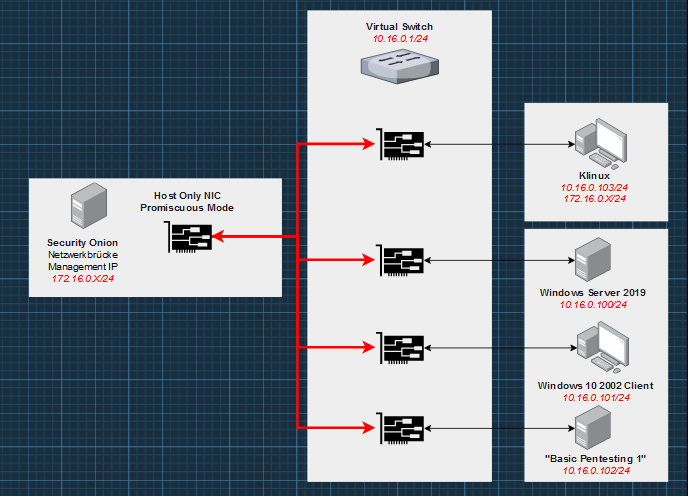
The promiscuous mode allows the network interface to receive and process the traffic between the systems (network 10.16.0.0/24) on the left side – only the addresses in the 172.16.0.0/24 network are excluded. Note that we need another interface/network for the clients when working with agents, this could be also done in the same network. But it's a much cleaner to separate those communications! so we will do this in our management network – 172.16.0.x – see the next article for this.
For physical provisioning, this is the sniffing interface (passive listening) – This requires one or more interfaces that are used exclusively for sniffing (they do not obtain an IP address). For virtual provisioning, this would be the interface that the NIC would be assigned natively (keyword NIC passthrough). NIC offloading functions like "tso", "gso" and "gro" should be disabled to ensure that Snort/Suricata/Zeek get an accurate view of the traffic (see https://blog.securityonion.net/2011/10/when-is-full-packet-capture-not-full.html).
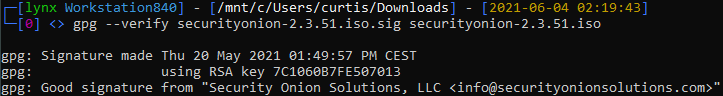
- Download ISO image and check integrity https://github.com/Security-Onion-Solutions/securityonion/blob/master/VERIFY_ISO.md
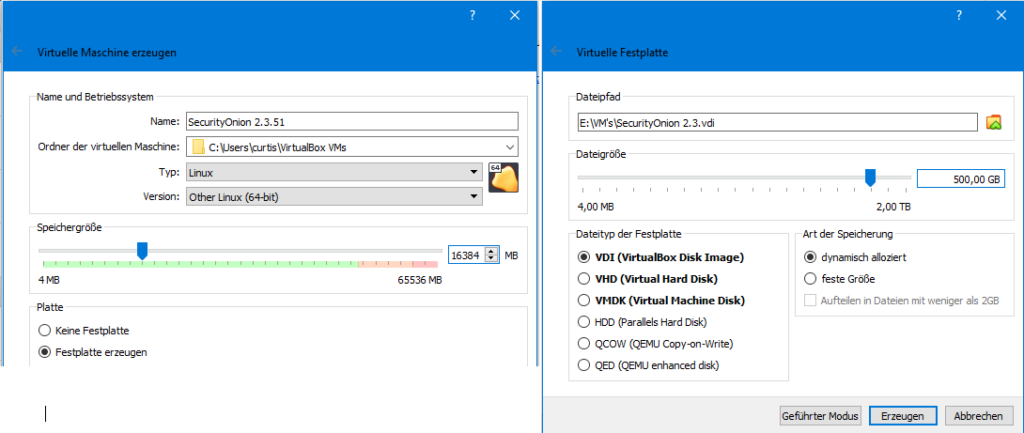
- Settings in Virtualbox – Creating a Virtual Machine – Virtual Hard Disk
As type and version would be ("Linux" and "CentOS" or "CentOS 64 bit") to choose, this option is no longer present in newer versions of VirtualBox, because Red Hat has decided to continue the development of the OS under a different name (https://www.cyberciti.biz/linux-news/centos-linux-8-will-end-in-2021-and-shifts-focus-to-centos-stream/). In our case, "Other Linux x86_64bit" is sufficient.
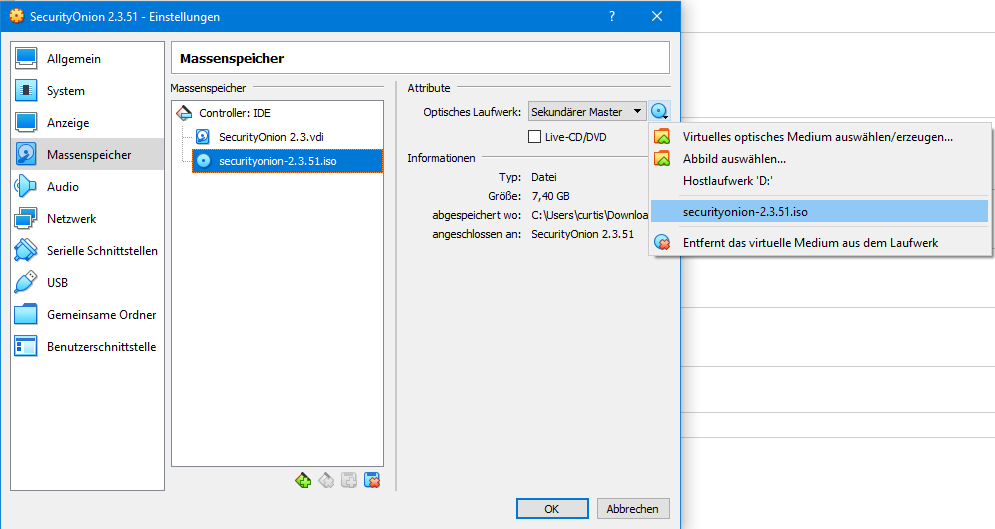
- Settings in Virtualbox – Mass Storage
To make Security Onion bootable, the downloaded ISO file must be read in as a secondary master.
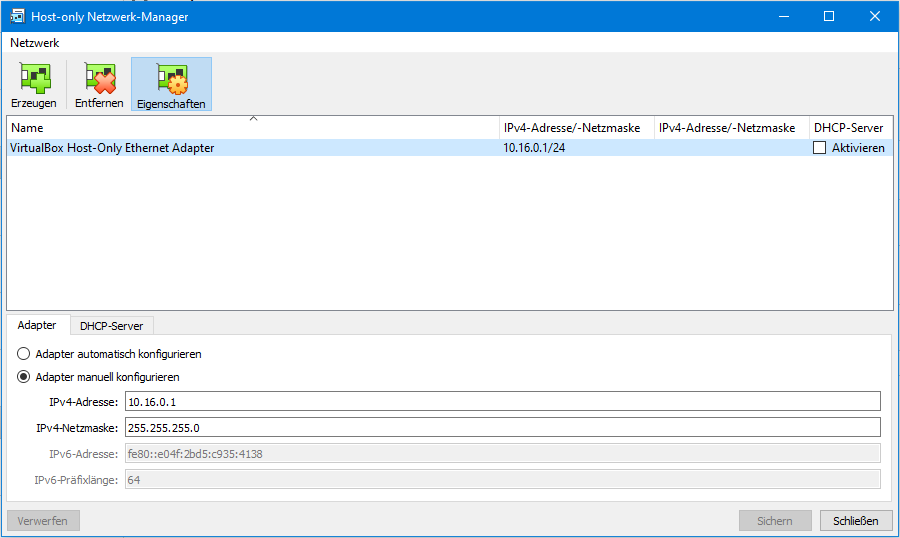
- Settings in Virtualbox – For the Host-only Network (File -> Host-only Network Manager)
If no "VirtualBox Host-Only Ethernet Adapter" exists yet, it can be created via "Create". The address is freely selectable within the defined private networks (rfc1918).
- Settings in Virtualbox – Network Settings – General Overview
The sniffing interface must now be set up in the network settings of the Security Onion VM. To do this, select the host-only adapter and activate the promiscuous mode under Advanced.
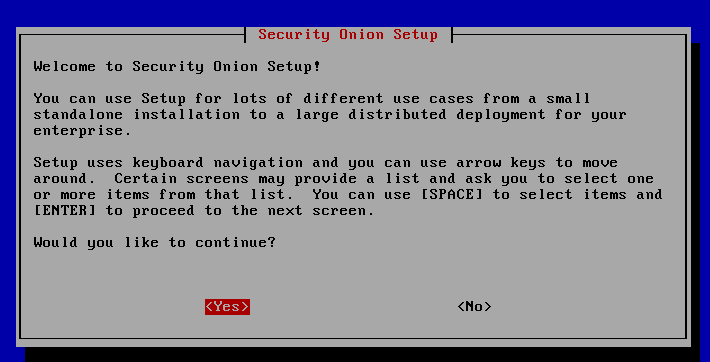
- Starting the VM
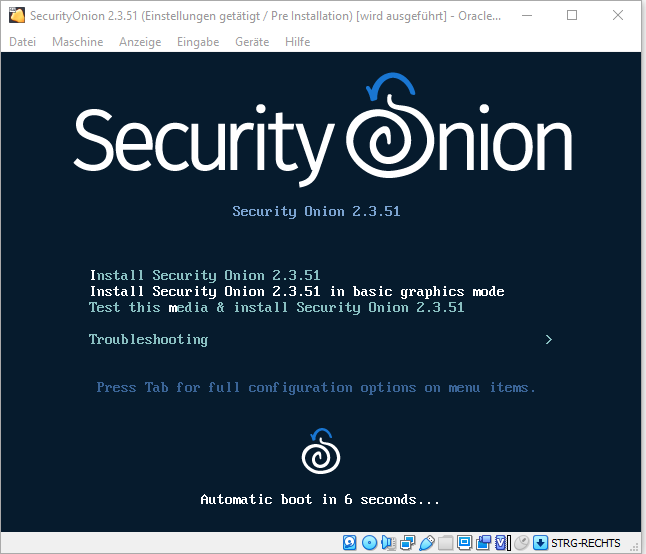
Boot menu – selection of the installation type
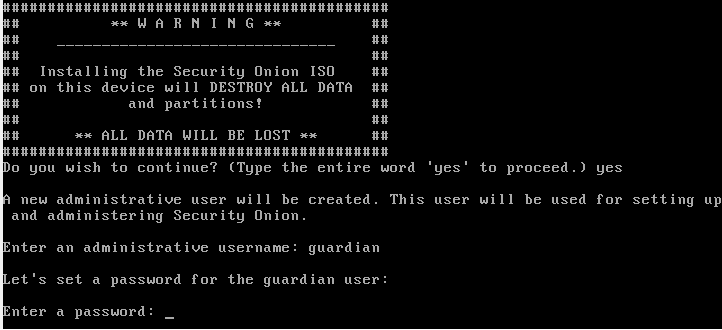
Once again, the user is explicitly informed that the further procedure formats and overwrites the existing data on the storage medium. In addition, the user and a password must be assigned for the further installation.

After you have set up the user, the CentOS will be installed, then you can reboot the system.
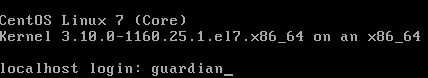
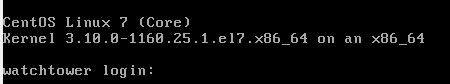
After restarting, you can log in with the previously assigned data. Only now the actual installation takes place.
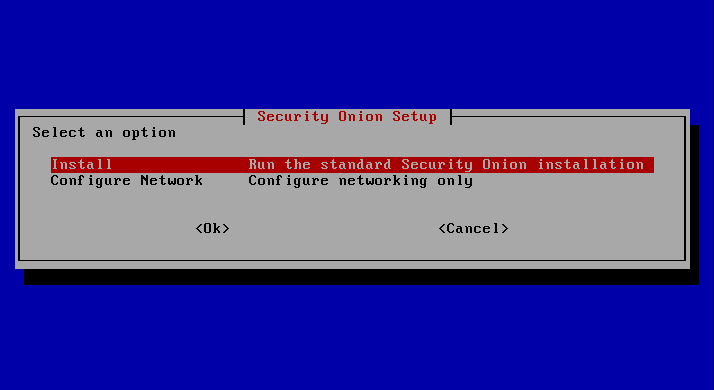
To perform the complete installation of all components, the option "Install" must now be selected. "Configure Network Only" would be an option if you want to install a stand-alone sensor.
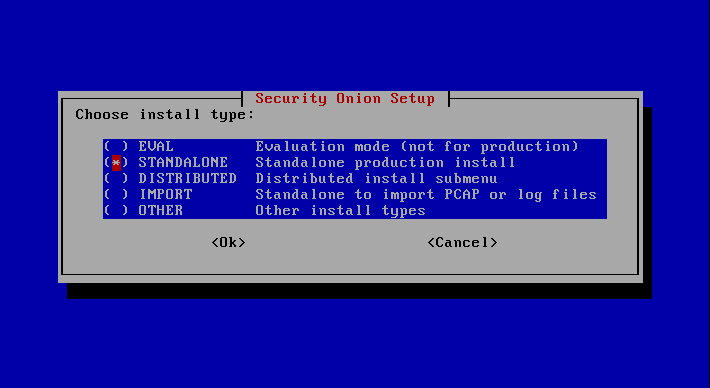
Since we install a sensor and a search node on one system, "Standalone" must be selected here.
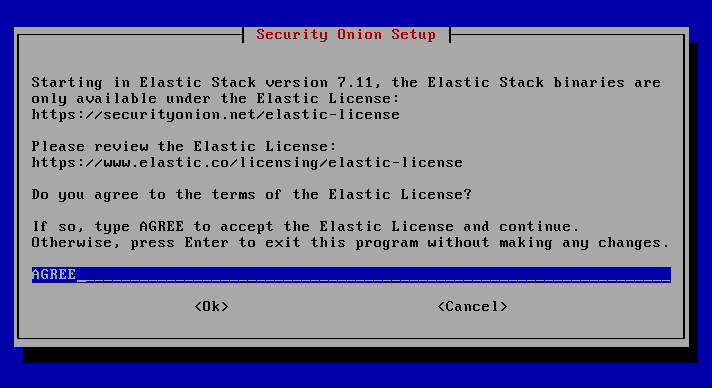
Here follows the agreement of the license terms for the use of Elastic Search.
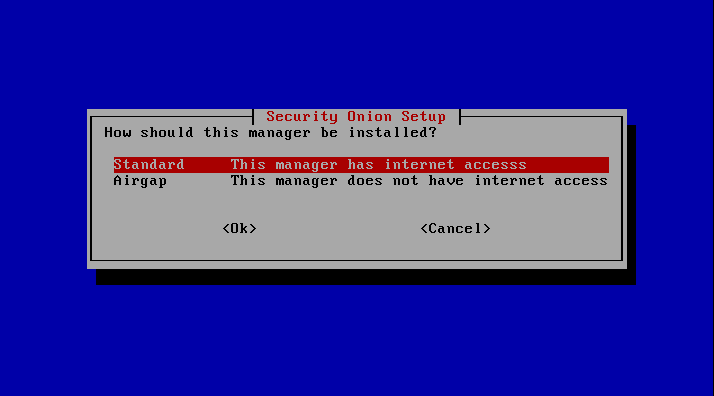
For air-gapped deployments, the "Airgap" option would be selected here, but since we want to download rule sets and keep the individual components up to date, the upper option should be selected here.
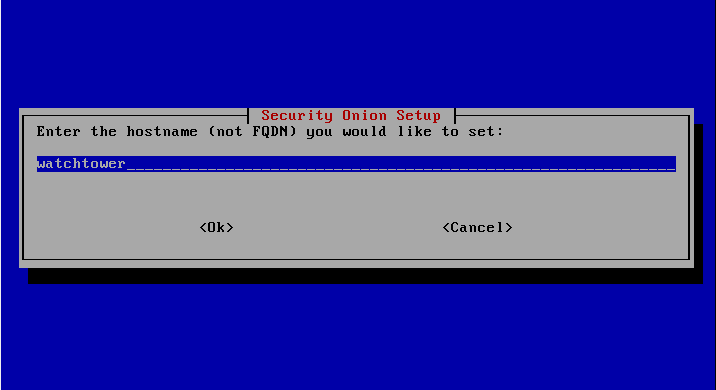
Selection of the host name.
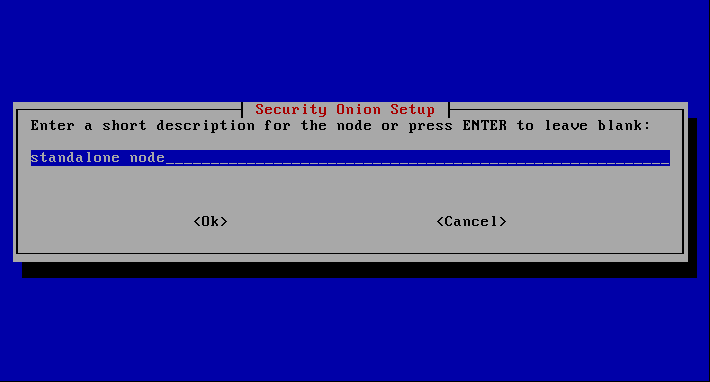
Optionally, a description of which system it is.

At this point the management interface is selected. In the Vm it is the first interface assigned to the host, therefore enp0s3 is selected here.
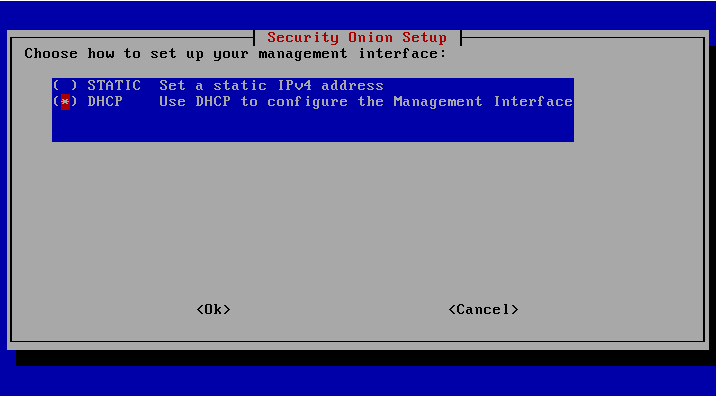
It is best to set the IP statically, in our case the router assigns leases for the entire /24 network. Therefore, the address is assigned via DHCP, then a reservation is entered in the router for the corresponding MAC address.
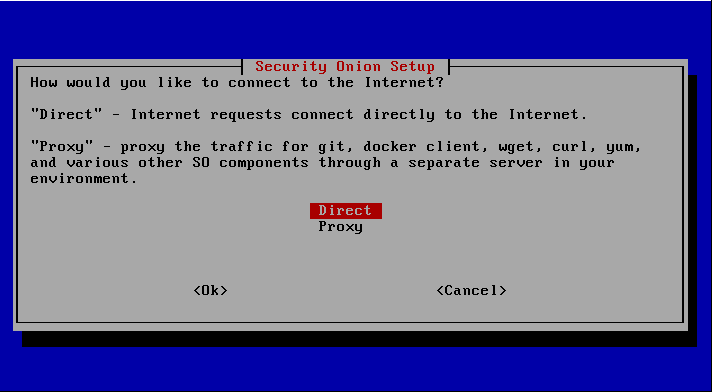
Proxy settings were skipped or the connection is established directly.
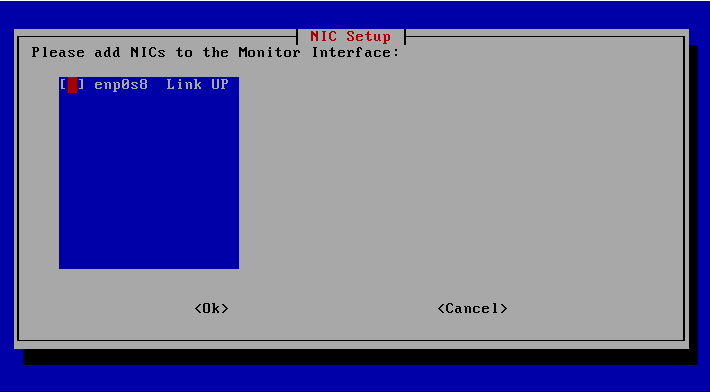
The monitoring/sniffing interface is now selected as the last network setting.
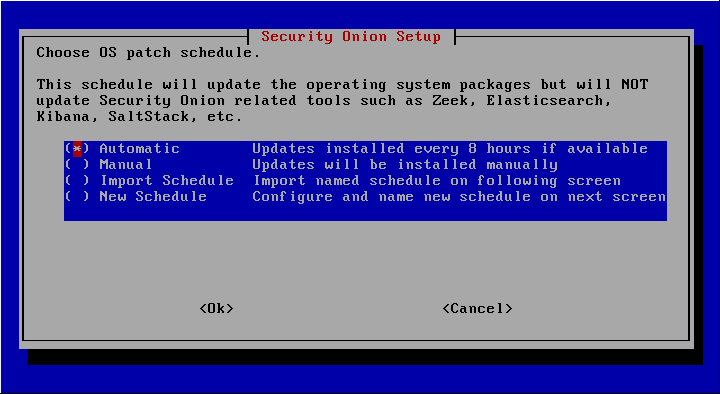
For productive environments, it should be evaluated whether updates are necessary and whether the smooth functioning is still guaranteed. In the case of the laboratory environment, automatic updates can be selected. After the successful completion of the installation, it is advisable to create a backup point.
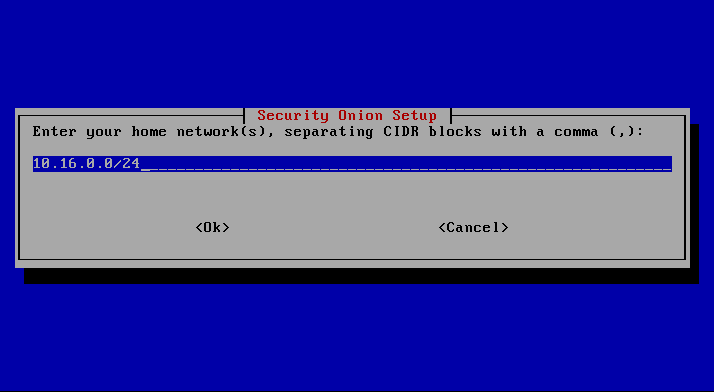
In this step, the network to be monitored is selected. Since the simulations are only performed in the 10.16.0.0/24 network, other networks can be eliminated here.
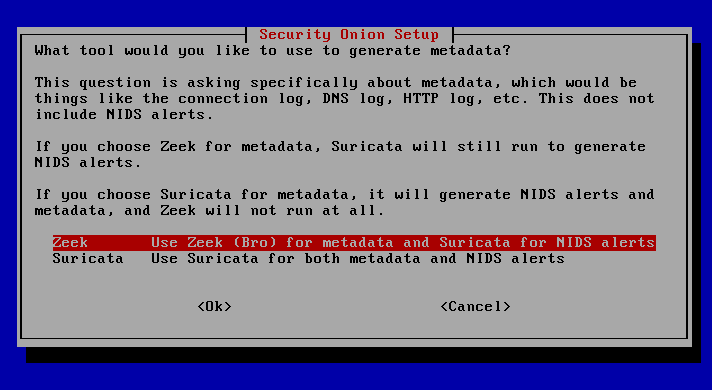
For the following selection, Zeek is chosen as the main component for the analysis of files and metadata. In this combination, the individual strengths of Suricata and Zeek are best exploited. Zeek provides in-depth contextual visibility of network traffic and Suricata enables powerful real-time monitoring of data flows for known threats.
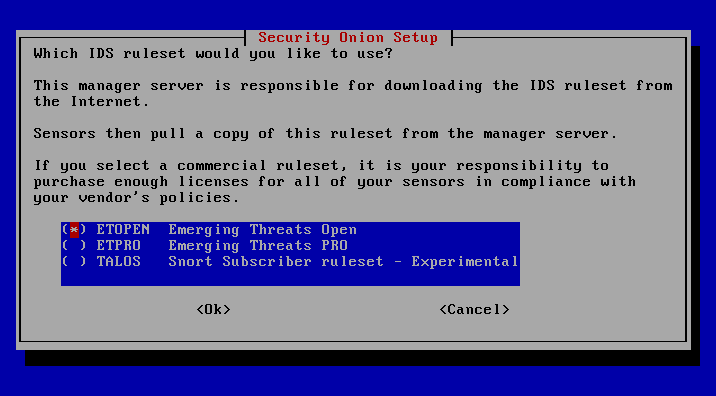
Since the Cisco Talos rule sets and the Emerging Threats Pro rule sets require licenses, the ETOPEN rule sets are chosen here. The list is updated weekdays on a daily basis and therefore, if you go by the Pareto principle (80% of incidents are caused by known threats that can be easily identified by signature-based rule systems, and 20% are from previously unknown threats), provides more than sufficient visibility.
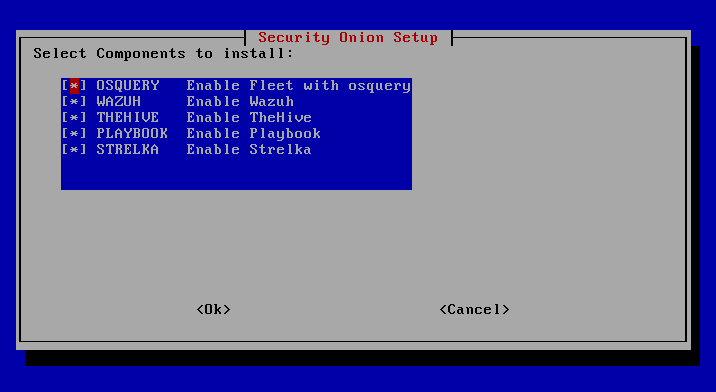
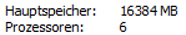
The VM has received sufficient resources to install all components.
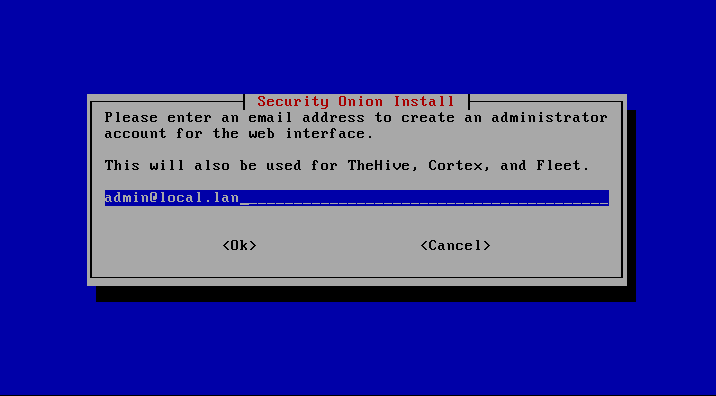
For access to the web interface (SOC – Security Onion Console), a user must still be set up.
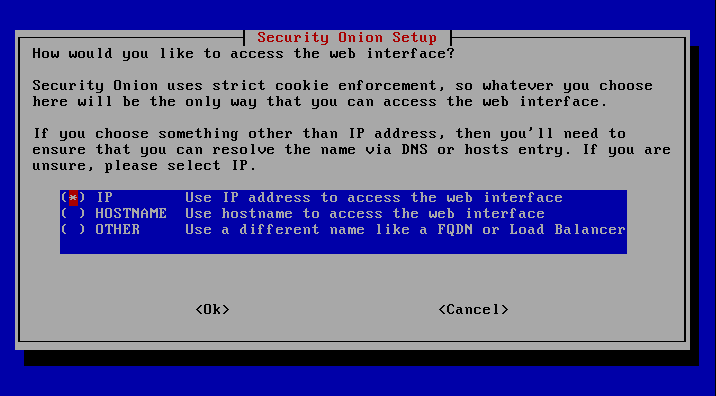
Here you can select the type of access to the SOC – it does not matter whether you select the IP address or the host name as long as the corresponding host/DNS entries are available.
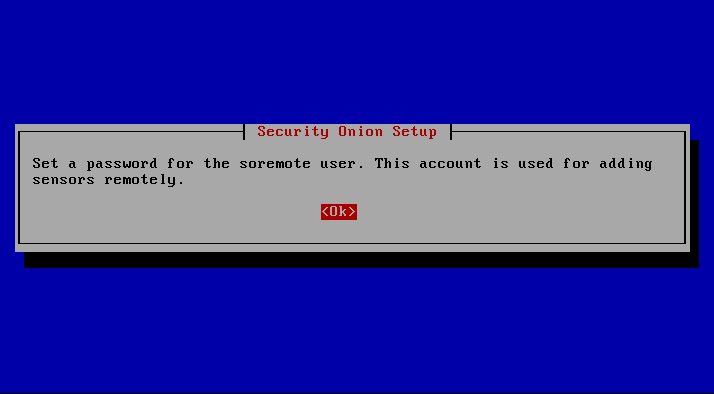
The last user to be created is for further setup of sensors and agents that send data/logs back to the node.
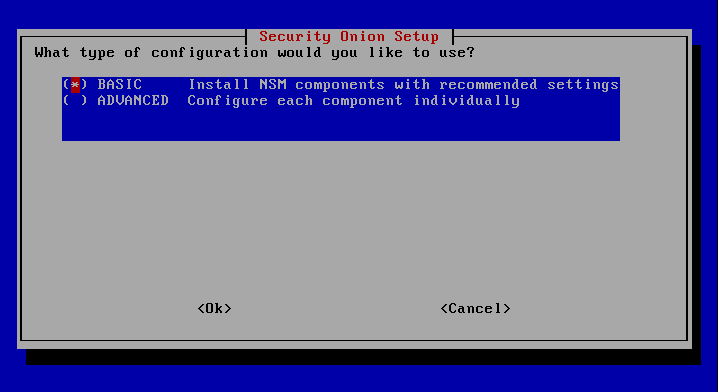
Afterwards, you can make further settings for the SearchNode and Kibana via Advanced, but since this is not necessary for the demo and small deployments, this step is skipped.
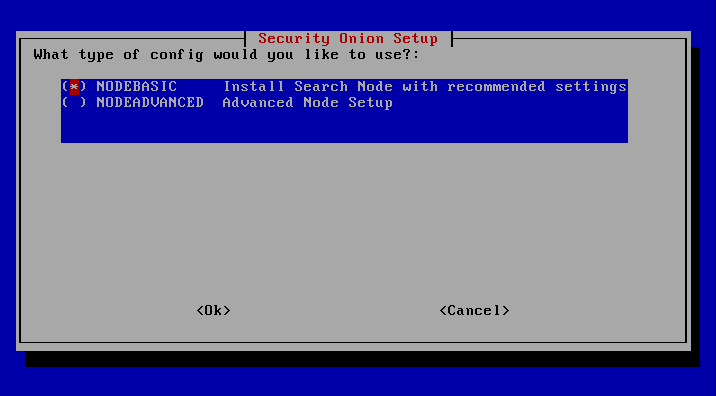
The selection "Nodebasic" sets up the SearchNode according to the recommended settings, via "Nodeadvanced" the configuration of ELK can be done manually.
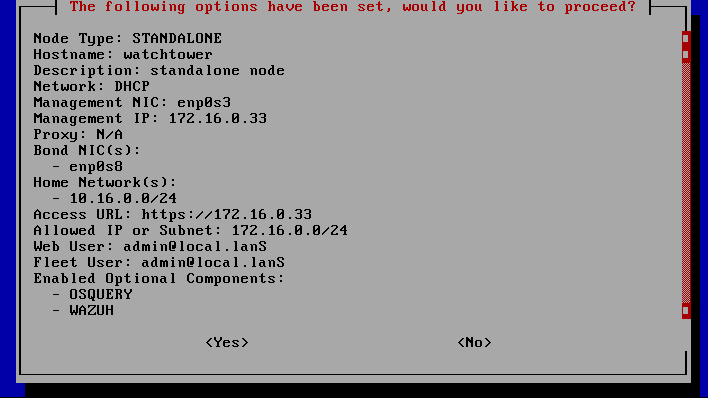
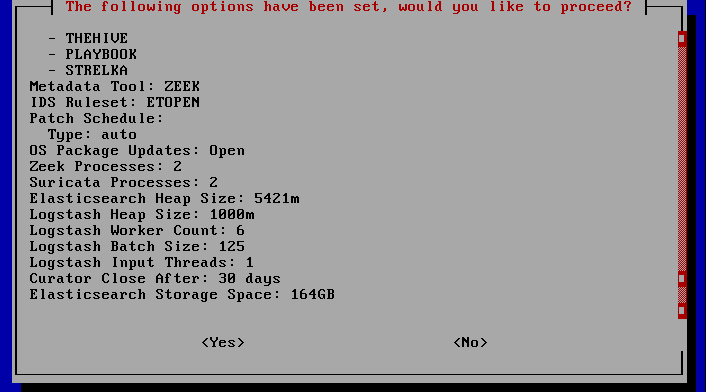
Before starting the installation of Security Onion, all settings can be viewed and changed if necessary.
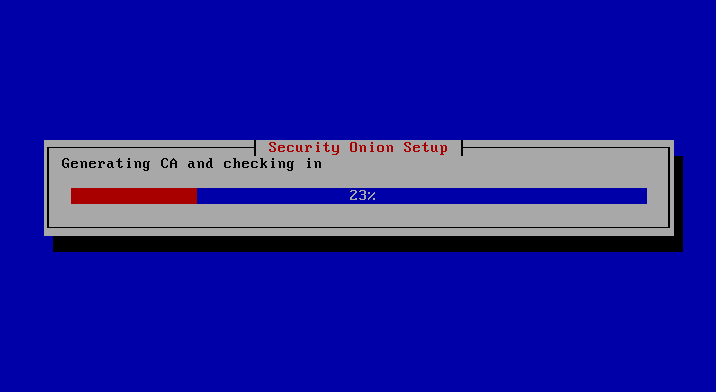
The installation of Security Onion is now largely automatic, after which you are asked to restart the system by pressing the Enter key.
Security Onion is now fully installed
But only now the actual configuration starts.
- Network shares for Analyst workstations, agents, SSH shares etc.
- Add systems to Fleet and Wazuh – gain more visibility
- Check individual rules from ETOPEN for sensefulness and deactivate them
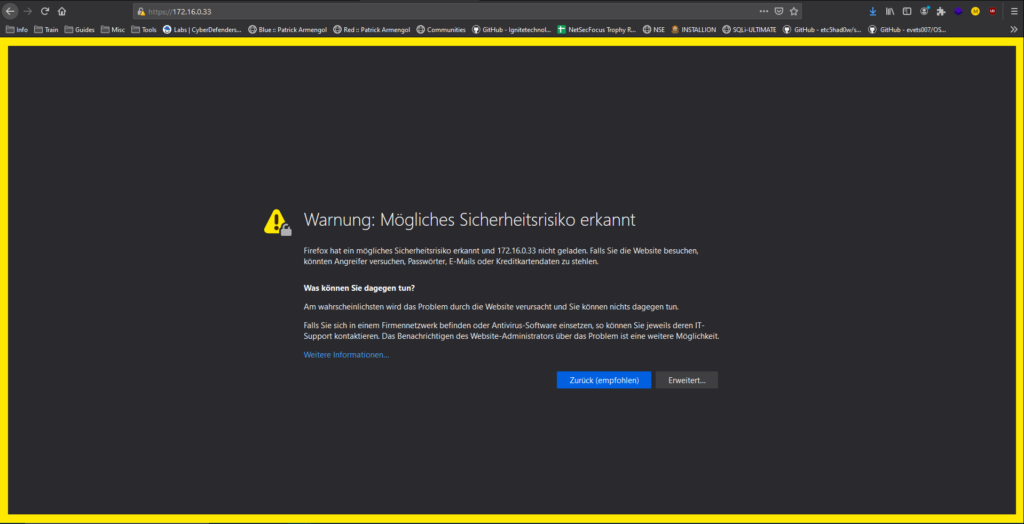
When calling the SOC a certificate error occurs, here you can possibly include the self-signed certificate.
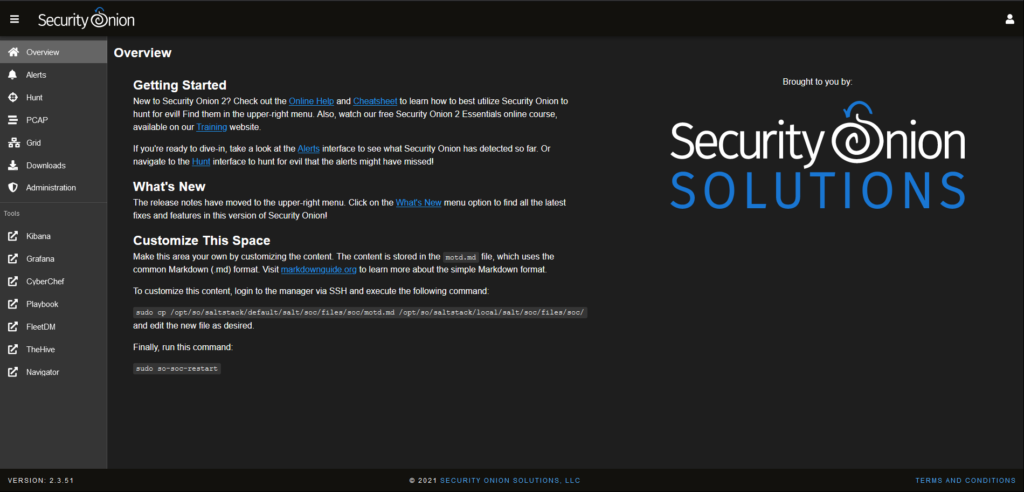
After entering the login data for the SOC, you can control the individual components and functions of the system.
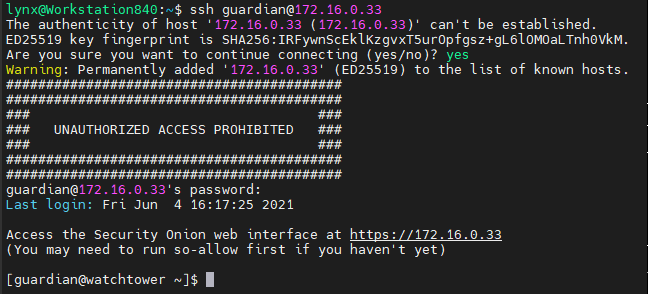
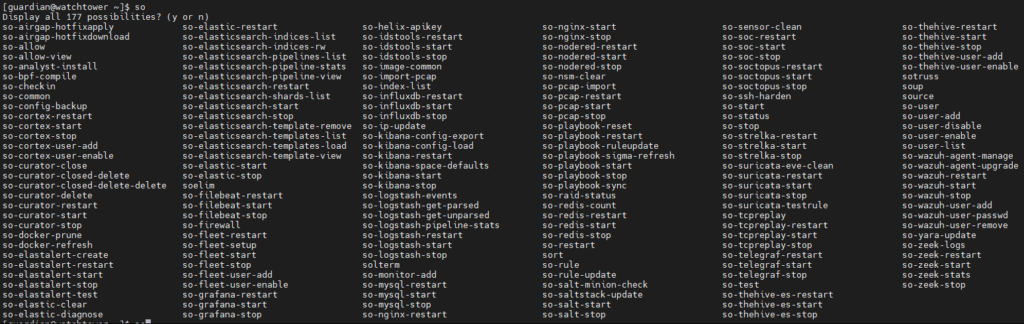
The administration of Secruity Onion is done via shell, the access was enabled before by so-allow as which adapats the firewall rules accordingly. Individual components can be subsequently maintained and configured at this point.
Finally, an overview of the Security Onion Commands.
Source: https://bjoern-hagedorn.com/security-onion-2-3/
0 Response to "How Easy is Security Onion to Get Setup"
Post a Comment